Machine Learning Rig: Metrics & Monitoring
Adding Monitoring and Metrics to my ML rig with Grafana and Prometheus
Having just finished building my ML rig and having a quick play around with it (with a study plan generated by ChatGPT) I realised my optics on the functioning of the rig were lacking, I wanted to be able to monitor things like GPU/CPU/RAM usage, and also have a way to monitor the temperature of the GPUs and CPU. Up until this point I just had a SSH+tmux session open running watch -n 1 rocm-smi and htop and it just wasn’t cutting the mustard.
I also have a continually growing number of servers and rpi’s that I want to monitor. Finding something that would also work for all of them would be ideal so I set aside a day to look into some monitoring solutions.
Goals
- Want monitoring/Metrics for the ML rig
- CPU/GPU/RAM usage
- Temperature
- Power usage
- Want to learn reusable skills/tools
- Bonus: Want to be able to monitor other machines (RPi’s, other servers, etc)
Research and Decisions
After a bunch of googling, I converged on two solutions I was interested in:
Weights and Biases

- Is a suite of widely used MLOps monitoring/lifecycle tools
- Looks like a good out of the box solution for ML monitoring
- Tracks experiments, metrics, hyperparameters, etc. In a very user friendly way
Prometheus & Grafana
![]()
![]()
- More general purpose monitoring solution
- A bit more work to set up, but more flexible/General
Decision
I decided to go with Prometheus and Grafana for a few reasons:
- I have several other machines I want to monitor (RPi’s, other servers)
- Eventually want to make a Grafana dashboard for my partner’s fish tank (heat/salinity/pH/etc)
- I want to set it up using Ansible (even more learning!)
- I have briefly used Prometheus and Grafana before (at work) and wanted to learn more about them
- I will likely learn about WandB in future projects anyway when I start experimenting with ML a lot more
Implementation
The following is an outline of how I set it all up, with links to the relevant code.
Prometheus and Grafana
On an existing server at my house I set up a docker-compose file based on their respective docs to run Prometheus and Grafana (and env vars in a .env for grafana credentials). It runs grafana on port 3000 and prometheus on port 9090.
With docker-compose being as awesome as it is, there isn’t much else to talk about here. Prometheus still needs configuring so it scrapes the metrics from the ML rig and other servers, but I’ll get to that once we’ve got metrics exposed to scrape.
Node Exporter and Ansible
Now that grafana and prometheus are running, I need to get metrics from my machines. After some googling I found node-exporter, and decided this would be a good place to start. It’s a prometheus exporter for machine metrics written in Go.
Seeing as I have a bunch of machines I want to monitor, I decided to use Ansible to install node-exporter on all of them. It probably took me just as long to learn Ansible as it would have to install node-exporter on all my machines manually, but it was a fun learning experience and it may come in handy in future if I need to set up a bunch of machines.
I set up an Ansible repo with an inventory of all my machines, and a playbook to install node-exporter.
I also set up a vault and put all the sensitive data (passwords, ssh keys, ip addresses etc) in it, allowing full configuration as code.
I then ran the playbook on all my machines with:
ansible-playbook \
  -b \
  -i inventory.yaml \
  --extra-vars=@vault.yaml \
  --ask-vault-pass \
  playbooks/node-exporter.yaml
And voila, node-exporter was installed on all my machines. Magic!
Custom ROCm Prometheus Metrics Exporter
This is good and all, but I still need to get metrics from my GPUs. I couldn’t find any easy out of the box prometheus clients for AMD GPUs, so I decided to write my own.
I wrote a quick wrapper on top of the rocm-smi cli in python (my native tounge) and used the prometheus python client to expose the metrics. I then set up a systemd unit to run it on boot.
The source code for this is available here. Note that I also had to make a slight patch to the rocm-smi cli to get it correctly exporting VRAM when the JSON flag is set. I’ve submitted a PR to the rocm-smi repo to get the fix merged in.
Prometheus Configuration
Now that I have metrics being exposed on all my machines (including the GPU specific stuff on the mlrig), I need to tell prometheus to scrape them. I set up a prometheus.yml (ip addresses/host names redacted) with scrape configs for all the node-exporters and the rocm-prom-metrics exporter. I then restarted prometheus and it started scraping all the metrics.
Final Result
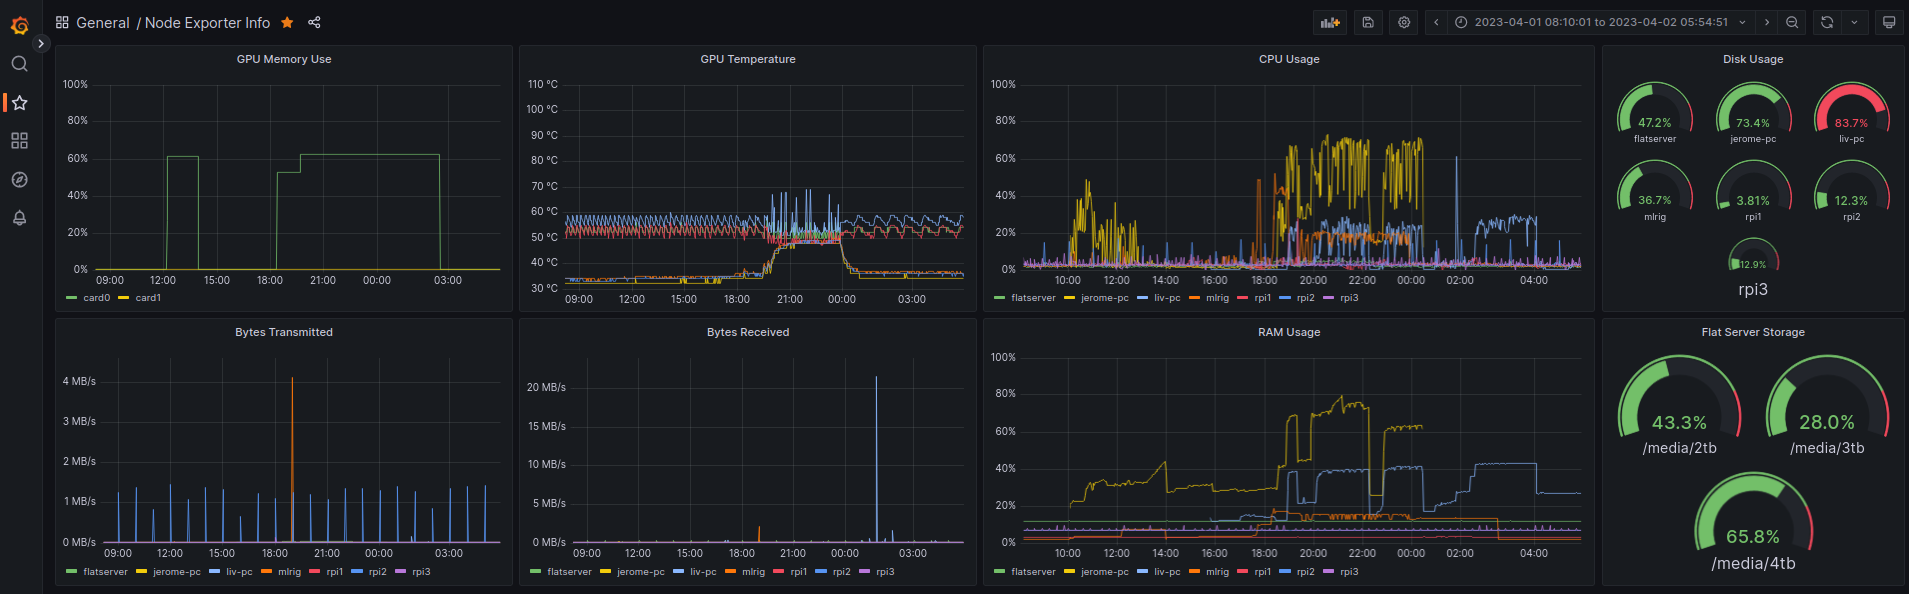
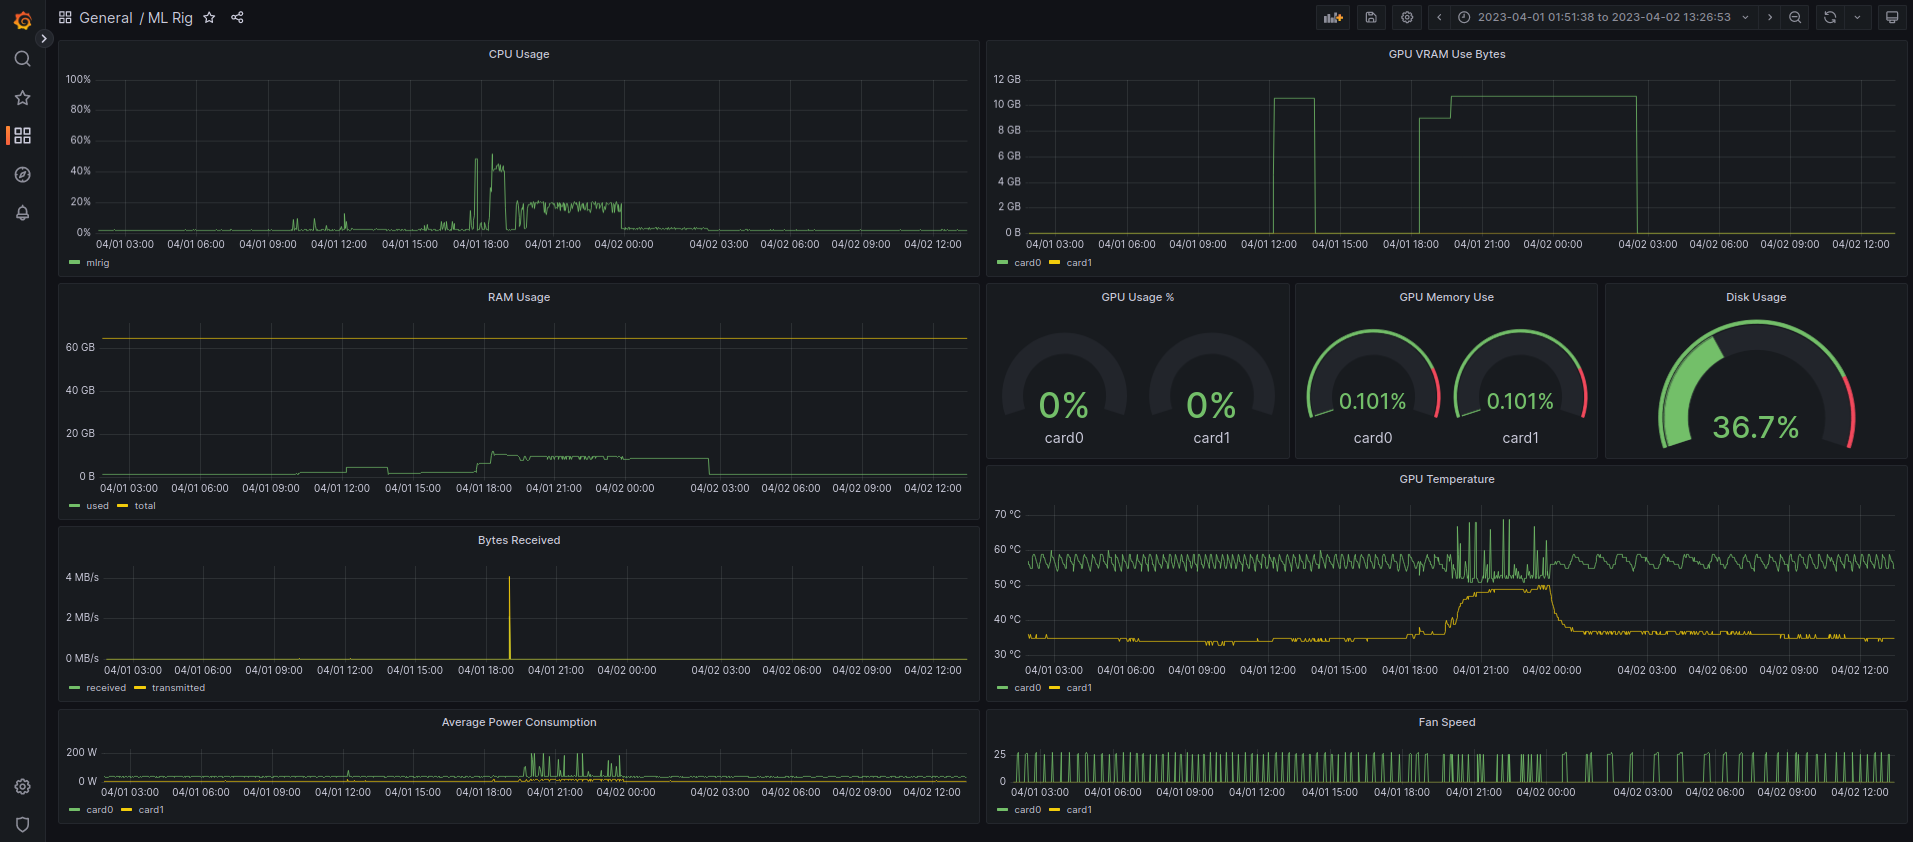
After all that, I put together two Grafana dashboards with all the metrics I want, one for the ML Rig, and another for all my other machines.
I can see the GPU usage, temperature, power usage, and CPU/GPU/RAM usage of the ML rig. I can also see the CPU/GPU/RAM usage of my 3 raspberry pi’s, server, 2 laptops, and me and my partner’s PCs. Looking very nice 👌👌
ML Rig Dashboard
Other Machines Dashboard